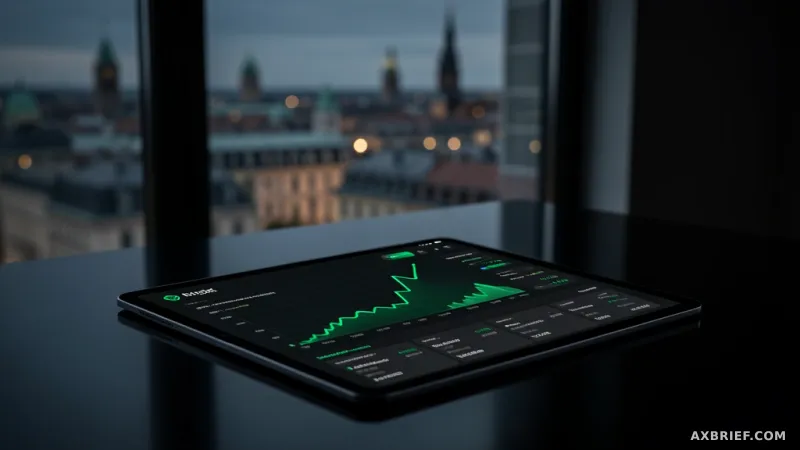
Imagine a retail investor in London at 2 AM, surrounded by glowing monitors. They are scanning a 40-page English transcript of a quarterly earnings call, desperately hunting for a single sentence about guidance or a specific risk factor. This ritual of manual scrubbing—jumping between a PDF, a stock chart, and a news feed—has been the standard for the individual trader for decades. The friction of financial research has always been the gap between having the data and understanding its meaning. That gap is about to close.

The Expansion of AI-Driven Intelligence in Europe

Google has officially rolled out an AI-enhanced version of Google Finance across the European market. The centerpiece of this expansion is a comprehensive local language support system, allowing users to query everything from individual stock health to macro market trends in their native tongue. This is not a simple translation layer; it is a deep integration of AI that allows users to ask complex questions and receive synthesized answers backed by verifiable source links. To handle the most intricate financial queries, Google has deployed Deep Search, a specialized capability designed to parse vast amounts of data and provide a structured response that minimizes the need for manual verification.

Beyond the AI interface, the scope of real-time data has widened significantly. The updated news feed now integrates expanded coverage of commodities and cryptocurrencies, ensuring that volatility in digital assets or raw materials is captured and presented instantly. The most disruptive addition, however, is the Live earnings feature. This tool synchronizes live audio from corporate earnings calls with a real-time text script. To eliminate the need for manual note-taking, Google has layered AI-generated insights and highlighted annotations directly onto the script, flagging the most critical moments of the call as they happen in real time.

From Passive Data Portals to Active Analysis Terminals

For years, financial portals functioned as passive archives. A stock chart told you that a price dropped on a specific Tuesday in October, but it rarely told you why. Google Finance is transforming the chart into an interactive timeline. By selecting a specific data point on a price curve, users can now immediately access the catalyst behind that movement, linking the price action directly to the news or event that caused it. The addition of technical indicators, such as moving average envelopes—which visualize the range of price volatility—allows users to perform professional-grade technical analysis directly within the browser rather than relying on expensive third-party software.

This represents a fundamental shift in how information is consumed. Previously, an investor had to listen to an hour-long audio file or use a search function to find a specific keyword in a transcript. The AI now acts as a real-time filter, distilling hours of corporate jargon into actionable highlights. This effectively lowers the barrier to entry for retail investors who lack professional Bloomberg terminals or deep financial training. By interpreting context rather than just listing numbers, the platform moves the user from the stage of data collection to the stage of actual analysis.

The fragmentation of the research process—switching between a news site, a brokerage app, and a transcript—is replaced by a single, continuous AI-driven session. When the AI provides an answer alongside a verifiable link, it solves the trust problem inherent in generative AI, ensuring that the investor is not relying on a hallucination but on a documented corporate statement. This integration ensures that the continuity of analysis is never broken by the need to switch tabs.

Google Finance has evolved from a simple information portal into a real-time AI financial analysis terminal.