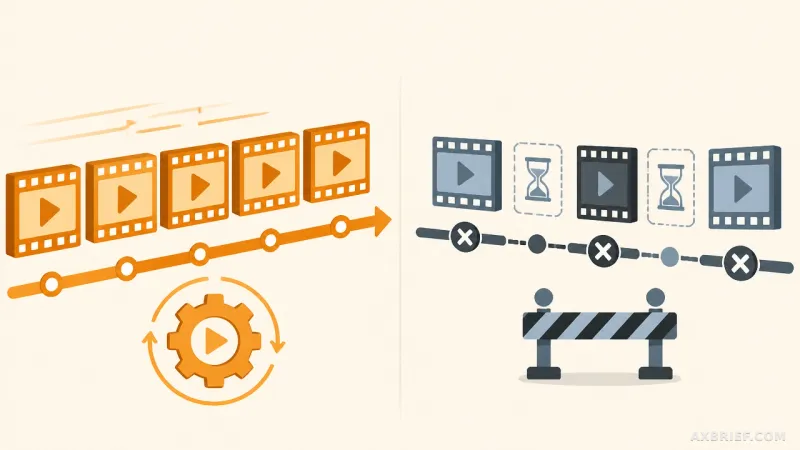
The modern developer's experience with AI-generated data visualization is often a exercise in frustration. You prompt a large language model to create a complex chart, and it returns a block of Python or JavaScript code that looks perfect at a glance. However, the moment the chart renders, the reality sets in: the X-axis labels are overlapping in an illegible mess, the legend is obscuring the primary data points, and the color palette is functionally indistinguishable. The developer is then forced into a tedious cycle of manual code correction, spending more time fixing the AI's layout mistakes than analyzing the actual data. This gap between the AI's conceptual understanding of a chart and the technical precision required for a polished visual is where the current pipeline breaks.
The Architecture of Flint and the Specification Shift
To bridge this gap, Microsoft Research, in collaboration with the IDEAS Lab and Renmin University of China, has introduced Flint. Rather than asking an AI to write raw rendering code, Flint introduces a visualization intermediate language. This approach shifts the AI's responsibility from writing low-level implementation details to generating a high-level, human-readable specification. This specification acts as a concise blueprint that defines what the chart should represent without getting bogged down in the minutiae of coordinate systems or pixel-perfect padding. By reducing the output to a short set of core configuration values, Flint minimizes the surface area for AI errors and allows human developers to edit the resulting specification with far less friction than rewriting a full script.
For developers looking to integrate this into their current stacks, Microsoft has provided two primary implementation paths. Those working within TypeScript or JavaScript environments can integrate the tool directly via npm. For those building more complex autonomous systems, Flint is available as an MCP server. By leveraging the Model Context Protocol, AI agents can treat visualization as a standardized tool call, ensuring that the communication between the model and the rendering engine follows a strict, predictable schema. This integration ensures that the AI agent is not just guessing at code, but is instead interacting with a structured system designed for visual accuracy.
To ensure the tool is immediately useful, the project has been released as open source on GitHub. It arrives with a robust library of 46 different chart types and 83 gallery examples. These examples serve as a reference for both the AI and the human operator, providing a standardized starting point that eliminates the need to build complex visualizations from scratch.
From Code Generation to Semantic Compilation
The true technical pivot of Flint lies in its compiler, which moves the burden of layout logic from the AI to a deterministic system. In a traditional workflow, the AI must calculate the spacing for a grouped bar chart based on the number of data points. If the data grows, the layout breaks. Flint solves this by utilizing semantic types. The compiler recognizes specific data meanings such as Rank, YearMonth, Delta, and Temperature. When the compiler sees a field labeled as Temperature, it does not just see a number; it understands the nature of the data and automatically determines the appropriate scale, axis intervals, and formatting rules.
This semantic awareness extends to the visual aesthetics. The compiler autonomously handles data parsing, formatting, and the application of color schemes based on the inferred meaning of the data. This removes the need for the AI to manually specify hex codes or coordinate offsets, which are the primary sources of visual glitches in AI-generated charts. Furthermore, Flint implements a flexible layout model based on banking principles. This system dynamically manages the distribution of space between elements. If a chart's data volume increases—for instance, if a grouped bar chart suddenly needs to display twenty categories instead of five—the compiler automatically adjusts the band width or expands the canvas size to maintain visual integrity. The result is a chart that remains legible regardless of the input data's scale.
Perhaps the most significant advantage for the developer is the abstraction of the rendering backend. Flint provides a unified interface that supports Vega-Lite, ECharts, and Chart.js. In the past, switching from a library like Vega-Lite to ECharts would require a complete rewrite of the visualization code because their APIs are fundamentally different. With Flint, the intermediate specification remains identical. If a developer realizes that Vega-Lite lacks a native sunburst chart for a specific hierarchical dataset, they can switch the backend to ECharts without changing a single line of the AI-generated specification. The intermediate language acts as a translation layer, decoupling the intent of the visualization from the technical limitations of the rendering library.
By inserting this intermediate layer, Microsoft has effectively created a collaborative loop. The AI handles the initial conceptualization and specification, the compiler handles the mathematical precision of the layout, and the human provides the final semantic polish. This removes the binary choice between fully manual coding and unreliable AI generation, replacing it with a system where the AI proposes a structure that is guaranteed to be renderable and easily adjustable.
This shift toward intermediate languages suggests a future where AI agents no longer struggle with the final mile of production-ready assets, but instead operate through standardized specifications that guarantee professional output.