The modern site reliability engineer lives in a state of perpetual context switching. A typical incident response begins with an AI agent providing a plausible root cause hypothesis based on a flurry of logs and traces. The agent might claim that a specific microservice is experiencing a latency spike due to a database lock, but the engineer cannot simply take the LLM's word for it. To verify this claim, the engineer must leave their IDE, open a browser, navigate to an observability dashboard, log in, and manually reconstruct the query the AI used to reach its conclusion. This friction creates a verification gap where the speed gained by AI-driven analysis is immediately lost to the manual labor of visual confirmation.
The Dual Response Architecture of OpenSearch MCP Apps
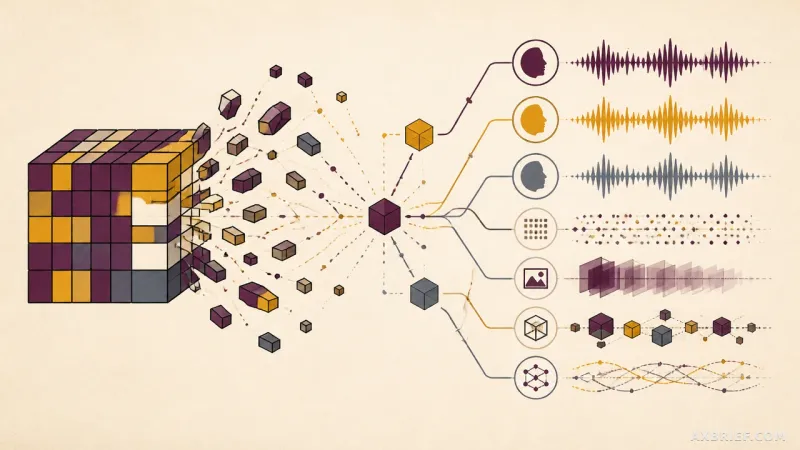
Amazon OpenSearch Service MCP Apps addresses this bottleneck by extending the Model Context Protocol (MCP) to implement what is known as a dual response pattern. In a standard AI interaction, a tool call returns a string of text that the LLM then summarizes for the user. Amazon OpenSearch MCP Apps changes this flow by returning two distinct payloads simultaneously: a structured text summary designed for the AI's reasoning process and an interactive visualization artifact designed for human consumption. When an engineer asks an agent to investigate a system failure, the agent queries the Amazon OpenSearch Service, and the response arrives in the chat thread as both a textual analysis and a rendered dashboard widget.
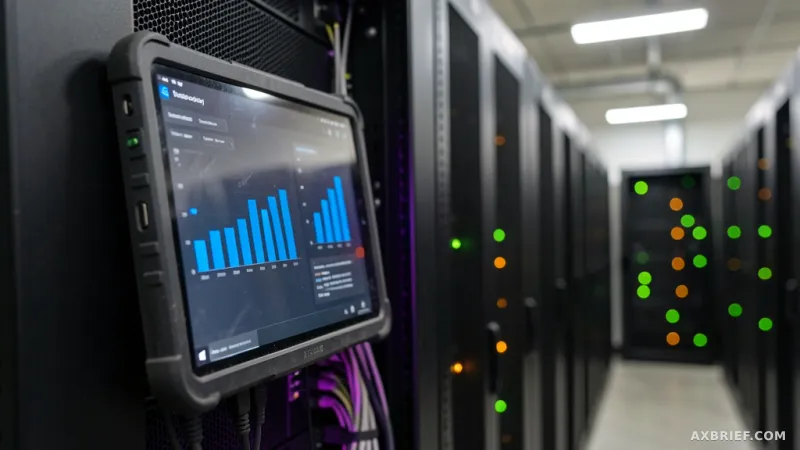
These visualization artifacts are not static images but interactive components including trace waterfalls, service topologies, and log pattern views. The trace waterfall allows engineers to see the request flow in chronological order to pinpoint exact latency bottlenecks. The service topology maps dependencies between services to visualize the blast radius of a failure. Meanwhile, the log pattern view groups similar log entries to highlight failure signatures that would otherwise be buried in millions of lines of text. By rendering these widgets directly within the conversation, the system allows the user to expand individual spans or inspect attributes without ever leaving the chat interface.
The underlying architecture relies on a local MCP server that runs on the user's machine, acting as a secure bridge between the agentic IDE and the OpenSearch UI application. The data flow follows a strict path: the IDE sends a request to the local MCP server, which forwards it to the OpenSearch UI endpoint, which then queries the actual data source. This architecture supports a wide array of integrations, including OpenSearch domains, serverless collections, Amazon CloudWatch, and Amazon Managed Service for Prometheus. Because the local MCP server utilizes the user's existing AWS credentials and policies, all data remains within the user's AWS account, ensuring that security and governance are maintained while improving the developer experience.
Deterministic Rendering vs. LLM Interpretation
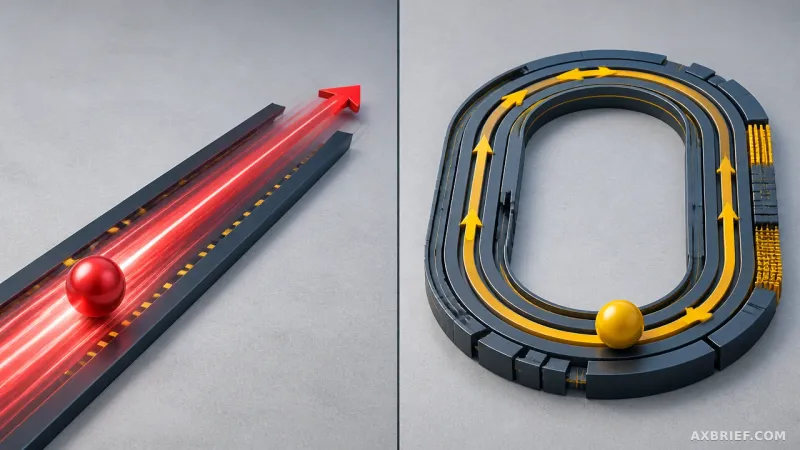
The critical distinction between MCP Apps and standard AI-integrated dashboards lies in the concept of deterministic rendering. In most AI-driven observability tools, the LLM is asked to interpret data and then describe it or even attempt to generate a chart using a library like Matplotlib or Mermaid.js. This approach is inherently probabilistic, meaning the AI can hallucinate data points or misrepresent the scale of a spike, leading to a dangerous lack of trust in the tool's output. The engineer is forced to verify the AI's chart against the actual dashboard, which brings the verification gap back into play.
Amazon OpenSearch MCP Apps eliminates this risk by bypassing the LLM for the visual component of the response. The visualization is generated on the server side by executing actual code against the data source. The resulting widget is a direct reflection of the raw data, ensuring that the output is deterministic. If a user were to run the same query manually in the OpenSearch dashboard, they would see the exact same chart. The LLM is used only to provide the narrative context and reasoning, while the visual evidence is provided by the system of record.
This separation of concerns creates a high-trust environment. The AI provides the hypothesis, and the deterministic widget provides the proof. By establishing these two parallel paths—one for AI reasoning and one for human verification—the system allows the engineer to instantly cross-reference the AI's claims with the actual state of the system. This removes the cognitive load of doubting the AI's interpretation and transforms the chat window from a simple text interface into a fully functional observability cockpit.
In a practical trace investigation workflow, this manifests as a seamless transition from triage to resolution. When the agent calls the trace investigation tool, the IDE passes parameters such as the Trace ID, service name, and time range to the local MCP server. The server authenticates via AWS and requests the data from the OpenSearch UI endpoint. The response returned to the IDE contains a structured text summary detailing the total duration, span count, and the critical path where the failure occurred, alongside an interactive waterfall chart. The engineer reads the summary to understand the context and then glances at the waterfall chart to visually confirm the error span, completing the root cause analysis in seconds rather than minutes.
This integration effectively collapses the distance between the analytical hypothesis and the empirical evidence, turning the IDE into the single source of truth for incident response.