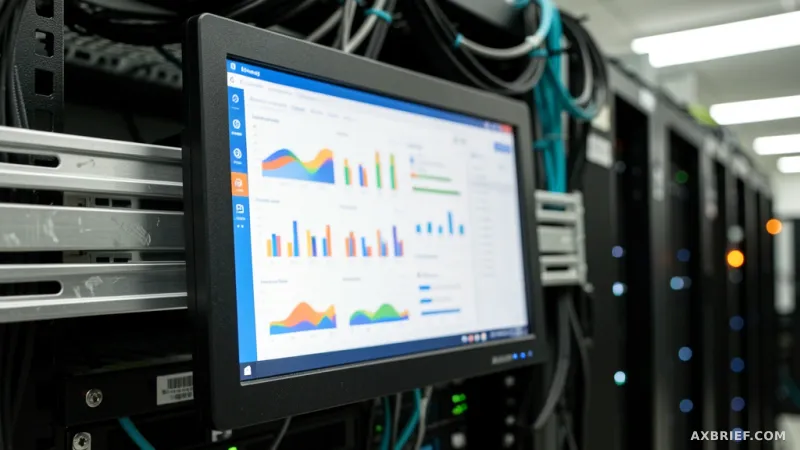
The modern corporate boardroom is often a place of high tension, but for years at GoDaddy, that tension was fueled by a spinning loading icon. Imagine a financial executive or a marketing lead attempting to pull a critical performance report during a live strategy session, only to wait fifteen minutes for a single dashboard to render. In an organization managing 82 million domain names and serving over 20 million customers, this latency was more than a nuisance; it was a systemic failure. The data existed, but the bridge to reach it was collapsed under the weight of thousands of legacy reports and a centralized BI team that had become a permanent bottleneck for every department in the company.
The Architecture of a Global Migration
By early 2023, GoDaddy's data and analytics product team recognized that their existing BI infrastructure had reached a breaking point. The environment was cluttered with thousands of dashboards, and the operational model required every single analysis request to pass through a central BI team. This created a queue that far exceeded the team's capacity, leaving business units in the dark. After a rigorous evaluation of the market and their own internal roadmaps, GoDaddy selected Amazon QuickSight as the replacement. The transition began in mid-2023, with a soft launch in the third quarter and a foundational phase that lasted through the end of the year. This initial period focused on AWS integration, the establishment of a governance framework, and the migration of primary dashboards.
Throughout 2024 and 2025, the rollout expanded across all business units, culminating in the total decommissioning of the legacy BI tools in December 2025. The scale of the adoption is evident in the user metrics: the system now supports 4,298 active users, consisting of 828 dashboard authors and 3,128 readers. This migration was not merely a software swap but a complete overhaul of how the company consumes information, resulting in a documented saving of 15,000 work hours annually.
To achieve this, GoDaddy leaned into a native AWS ecosystem. By integrating QuickSight directly with Amazon Redshift, Amazon S3, and Amazon RDS, the company eliminated the latency typically associated with moving and transforming data between disparate cloud environments. They adopted a serverless auto-scaling architecture, which allowed computing resources to expand and contract automatically based on user demand and data volume. This removed the operational overhead of managing server clusters and shifted the financial model to a pay-as-you-go structure. This pricing shift ensured that costs remained predictable and that the company stopped paying for idle resources during low-traffic periods, all while maintaining the horsepower necessary to render massive datasets instantly.
From Data Gatekeeping to the 1/10/60 Model
While the technical migration provided the speed, the real transformation occurred when GoDaddy addressed the psychological and organizational debt of their data culture. The company initiated what they termed a dashboard diet. They discovered that their legacy environment contained over 5,000 dashboards, many of which were redundant or obsolete. Rather than migrating this clutter, they aggressively pruned the portfolio, leaving fewer than 2,500 optimized assets. This reduction cut management overhead by more than 50 percent and forced the organization to focus on high-value metrics rather than vanity reports.
The most striking example of this shift is the Cash Dash, the single source of truth for the company's financial performance. Developed through a collaboration between the business analysis and commercial teams, the Cash Dash is accessed daily by executives and operational stakeholders to monitor key financial and customer metrics. Before the migration, this critical report took 15 minutes to load. Today, it renders in under 5 seconds. This shift from a quarter-hour wait to near-instantaneous access fundamentally changed the pace of decision-making at the executive level.
However, the true twist in GoDaddy's strategy was the implementation of the 1/10/60 model. By leveraging QuickSight's built-in machine learning for anomaly detection, the finance team moved from reactive reporting to proactive incident response. The 1/10/60 framework dictates that an anomaly must be detected within 1 minute, the root cause investigated within 10 minutes, and the issue resolved within 60 minutes. When the system detects a financial discrepancy, an automated alert is pushed through integrated communication channels, allowing the team to kill a potential crisis before it scales into a major financial mismatch. This was further augmented by the Data Stories feature, which automates the generation of weekly executive summaries, removing the manual labor of report writing entirely.
The Era of the AI-Driven Self-Service Analyst
In October 2025, GoDaddy pushed the boundaries of self-service analysis by integrating Quick Research and Quick Flows. These AI-driven capabilities allow users to cross-reference internal corporate data with external public datasets and automate complex analytical workflows using natural language. To lower the barrier to entry for non-technical staff, GoDaddy deployed seven custom chat agents. The most impactful of these is the Dashboard Navigator, an agent designed to solve the eternal corporate struggle of finding the right report. Instead of emailing an analyst to ask where a specific metric is located, users simply ask the Navigator, which analyzes the intent and directs them to the correct asset among thousands of options.
To ensure this knowledge didn't vanish with employee turnover, the company established 30 Quick spaces, including a dedicated Dashboard Documentation Space. Here, 50 active users maintain a living record of why dashboards were created and how the data should be interpreted, preserving the analytical context for future teams. By combining natural language querying with these collaborative spaces, GoDaddy has effectively removed the analyst as the primary bottleneck. The goal shifted from reducing the analyst's workload to increasing the speed of problem-solving for the end user.
This evolution suggests that the future of business intelligence is not about building better charts, but about building better interfaces for curiosity. When a marketing manager can drill down into transaction types by geographic region or date range without writing a single line of SQL, the role of the data engineer shifts from a ticket-taker to a strategic architect. The success of the 1/10/60 model proves that when the distance between a question and an answer is reduced to seconds, the organization stops guessing and starts executing.