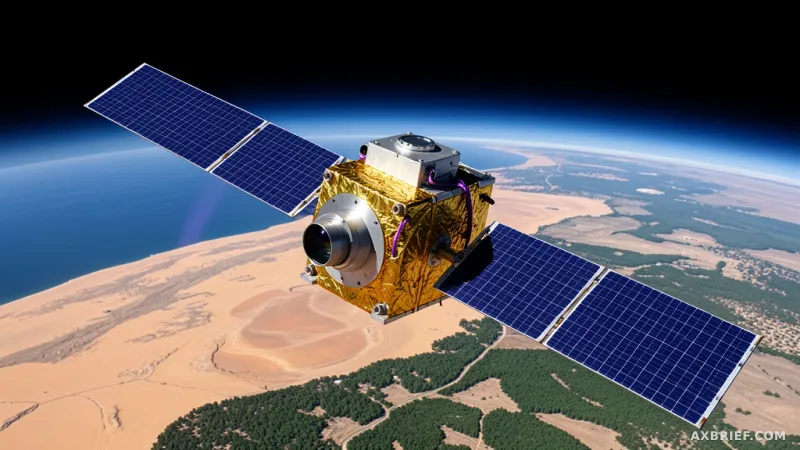
Geospatial analysts have long been trapped in a cycle of labeling hell. To map a specific ecosystem or track urban sprawl, the traditional pipeline requires thousands of meticulously hand-drawn polygons or expensive ground-truth surveys. This bottleneck often turns promising environmental projects into multi-year slogs, where the time spent annotating data exceeds the time spent actually analyzing it. The industry has waited for a way to move past the brute-force approach to supervised learning, seeking a system that understands the inherent visual language of the Earth before a single human label is even applied.
The Architecture of OlmoEarth Studio Embeddings
OlmoEarth Studio has introduced a specialized capability to calculate and export earth observation data as numerical representations known as embedding vectors. Rather than forcing users to interact with raw pixels, the platform allows them to define a specific region of interest, a time range, an encoder variant, and a resolution to generate Cloud-Optimized GeoTIFFs (COGs). The choice of the COG format is a strategic technical decision; these files are designed for cloud environments, allowing analysts to read only the specific portions of a massive dataset they need via HTTP range requests, which drastically reduces latency and bandwidth costs during large-scale transfers.
At the heart of this system are two model variants: the OlmoEarth-v1-Tiny model, which utilizes a 192-dimensional encoder, and the Base model, which scales up to 768 dimensions. Both models process Sentinel-2 L2A composite data at a 40-meter resolution. These encoders transform complex spectral data into a vector space where regions with similar surface characteristics are clustered together, while dissimilar terrains are pushed apart. Because the model weights and source code are open, the community can independently verify the embedding generation process, ensuring that the resulting vectors are not black boxes but mathematically grounded representations of the physical world.
The power of this approach was recently demonstrated in the mangrove forests of Ca Mau, Vietnam. Using the OlmoEarth-v1-Tiny model, researchers generated a land cover map with a weighted F1 score of 0.84. The most striking detail of this achievement is the data requirement: the team used only 20 pixel labels per class across three classes—mangroves, water bodies, and other terrains—totaling just 60 labels. By applying a standard logistic regression classifier to these embeddings, the system precisely delineated mangrove forests, tidal channels, and open water across the entire region.
The Saturation Point and the Shift to Semantic Querying
When analyzing the relationship between the amount of labeling data and model performance, a surprising phenomenon emerges. The research team found that increasing the number of labels from 30 to 300 resulted in almost no significant change in accuracy. This indicates a state of performance saturation. In traditional machine learning, more data typically leads to better results, but OlmoEarth behaves differently because it is a foundation model. The model has already internalized the ecological distinctions of the planet during its massive pre-training phase. The linear probe used for classification is not teaching the model what a mangrove looks like; it is simply asking the model to point to the features it already recognizes.
This shift transforms geospatial analysis from a training problem into a querying problem. To optimize the storage of these high-dimensional vectors, OlmoEarth Studio employs a signed 8-bit integer (int8) quantization structure. Vectors are stored as integers between -127 and +127, with -128 reserved as a nodata marker to handle missing values. This compression significantly lowers the memory footprint for global-scale datasets without sacrificing the underlying semantic structure. To return these values to a high-precision format for complex calculations, the platform provides the `dequantize_embeddings` function within the `olmoearth_pretrain` library, allowing users to toggle between storage efficiency and analytical precision.
This capability enables four distinct real-world analysis scenarios that bypass traditional training. In Merced, California, analysts extracted a query pixel from an urban center and calculated the cosine similarity against all other pixels in the area. Without any labels, the model produced a terrain heatmap where dense buildings and road networks glowed brightly while agricultural fields remained dark. When the query was shifted to a specific irrigated farm, the system identified all similar agricultural zones with a similarity score above 0.89, while airports and reservoirs were correctly ignored.
Temporal analysis becomes equally trivial. By measuring the cosine distance between embeddings from September 2023 and September 2024 in Butte County, California, the system immediately flagged the scars left by the Park Fire. This change detection was achieved using only two COG files and a few lines of Python code, requiring zero manual training. Furthermore, by applying Principal Component Analysis (PCA) to reduce embeddings to three dimensions and mapping them to RGB colors, analysts explored the reclaimed lands of Flevoland, Netherlands. The resulting unsupervised visualization clearly separated farmland boundaries, water, and urban zones into distinct hues.
For practitioners, the choice of workflow depends on the required precision. Frozen embeddings offer the fastest entry point, allowing users to extract features without altering model weights, which keeps computational costs low. For specialized applications requiring extreme granularity, Supervised Fine-Tuning (SFT) allows users to train the model head directly to optimize weights for a specific domain. These exported COG files integrate seamlessly with industry-standard tools like QGIS and GDAL, and can be manipulated in Python using the `rasterio` library.
To validate embedding quality in a new domain, the recommended pipeline is to first perform PCA visualization to understand the internal structure, followed by cosine similarity searches against known ground-truth points. Full implementation details and executable code are available in the official OlmoEarth Embedding Tutorial & Colab Notebook.
The transition from manual labeling to embedding-based querying marks a fundamental change in how we monitor the planet, turning the Earth's surface into a searchable database.