Modern AI engineering is currently defined by a paradox of choice. Developers are increasingly deploying sophisticated agents built on frameworks like LangGraph, CrewAI, and Strands Agents across a fragmented landscape of on-premises servers, Google Cloud Platform, and Microsoft Azure to avoid vendor lock-in or meet strict data residency requirements. However, this architectural freedom usually comes with a heavy observability tax. Until now, tracking the internal logic, latency, and token consumption of an agent running outside the AWS ecosystem meant managing a disjointed set of logs and third-party monitoring tools, leaving a critical visibility gap between where the agent executes and where the model is managed.
The Architecture of Multi-Cloud Telemetry
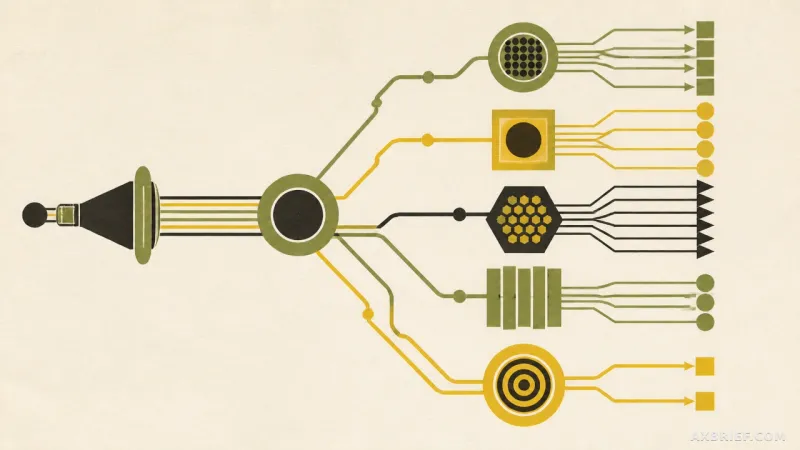
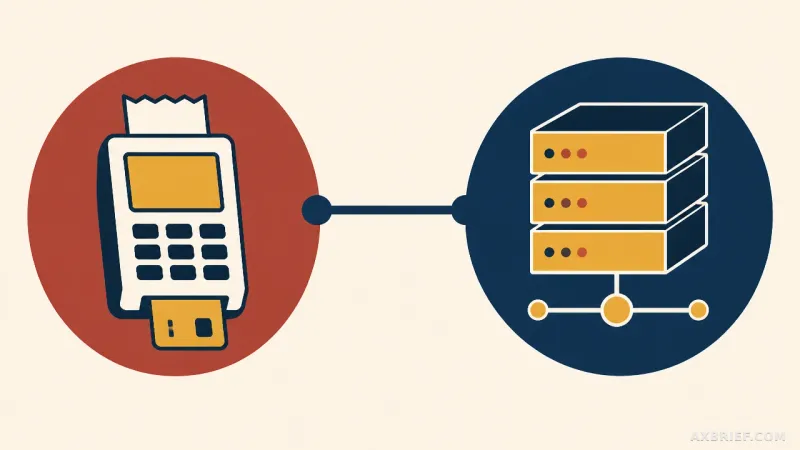
The expansion of Amazon Bedrock AgentCore Observability fundamentally changes this dynamic by allowing performance data from any infrastructure to flow into a single, unified dashboard. While the system originally provided native, zero-config support for agents deployed within the AgentCore runtime on AWS EKS, ECS, or Lambda, it now provides a standardized telemetry path for external environments. This means an agent running on a GCP virtual machine or a private data center can now transmit its system state and performance metrics directly to AWS CloudWatch.
This integration relies on ADOT, the AWS Distro for OpenTelemetry. ADOT operates within the same process as the agent application, utilizing automatic instrumentation to capture data without requiring developers to rewrite their core business logic. Specifically, it captures generative AI semantic convention spans. In the world of distributed tracing, a span represents the smallest unit of work, recording the start and end time of a specific operation along with its state. By adhering to semantic conventions, ADOT ensures that data names and formats are standardized across different platforms, allowing the system to track model call frequencies and response times in real time.
To establish this pipeline, the process begins with the activation of the Transaction Search feature in CloudWatch, which allows operators to isolate specific requests within massive telemetry streams. This is initiated via a single command that creates the necessary stream:
aws cloudwatch put-metric-stream --name "AgentCoreStream" --input-location "aws/otel"Once the stream is active, the environment requires the installation of two primary packages: `aws-opentelemetry-distro` and `strands-agents[otel]`. The former handles the OTLP (OpenTelemetry Protocol) export and manages SigV4 authentication via the `aws_configurator`, while the latter generates the actual tracing data within the Strands framework. Because these tools operate at the infrastructure level, the agent's internal code remains untouched.
Unlike the automated configuration found in the native AgentCore runtime, non-AWS deployments require manual environment variable mapping to define the data destination and identity. Developers must set `OTEL_EXPORTER_OTLP_ENDPOINT` to the specific CloudWatch OTLP endpoint and define `OTEL_SERVICE_NAME` to identify the agent within the dashboard. The final execution is handled by wrapping the Python process with the OpenTelemetry instrumenter:
opentelemetry-instrument python agent_test.pyThis wrapper automatically captures all Amazon Bedrock calls and Strands framework activities. Within minutes of execution, the CloudWatch dashboard populates with metrics identical to those produced by native AWS agents, including session data, trace spans, token usage, and end-to-end latency.
Beyond Connectivity: The Governance Gap
The real shift here is not just the ability to move data, but the transition from a black-box execution model to a glass-box reasoning chain. When an agent is deployed on a remote server, the most dangerous failure is not a crash, but a silent logic error. By routing telemetry through AgentCore Observability, developers can visualize the reasoning chain—the step-by-step logical progression the agent takes to reach an answer. This includes the exact tool calls made, the parameters passed to those tools, and the resulting model outputs. When a developer can see that an agent chose the wrong tool or misinterpreted a parameter in a GCP-hosted environment from an AWS dashboard, the debugging cycle shrinks from hours of log-diving to seconds of visual analysis.
This visibility is the primary defense against hallucinations. In a multi-cloud setup, an agent might produce a harmful or off-topic response that goes unnoticed if the logs are siloed in a different cloud provider's console. Centralized monitoring allows operators to identify exactly where a response diverged from the intended goal, enabling them to refine prompts or tighten guardrails immediately. It transforms the operational model from reactive troubleshooting to proactive alignment.
Furthermore, this setup solves the problem of cost governance in hybrid environments. AI resource consumption is notoriously difficult to track when agents are scattered across different infrastructures. By capturing input and output token counts per request and aggregating them in CloudWatch, organizations can implement precise budget controls and attribute costs to specific projects or departments regardless of where the compute happens. This creates a centralized audit trail, ensuring that security and compliance standards are met without requiring administrators to log into multiple cloud consoles.
There is, however, a strategic trade-off between the AgentCore runtime and this manual ADOT approach. The runtime offers maximum convenience and speed of deployment for those fully committed to the AWS ecosystem. In contrast, the manual ADOT configuration offers maximum sovereignty. For enterprises with strict data residency laws or legacy on-premises requirements, the slight increase in setup effort is a small price to pay for total infrastructure control. To secure this bridge, the use of IAM Roles Anywhere is recommended over long-term access keys. By using X.509 certificates to obtain temporary AWS credentials, on-premises workloads can communicate with CloudWatch without the risk of permanent credential leakage.
This framework has been validated through tests in environments like the GCP Cloud Shell, proving that telemetry remains consistent regardless of the underlying provider. Because the system is built on the OpenTelemetry standard, this pattern is not limited to Strands Agents; any agent framework that supports OpenTelemetry can theoretically be integrated into this centralized monitoring architecture.
The industry is moving toward a future where the location of the compute is irrelevant, provided the observability is unified.