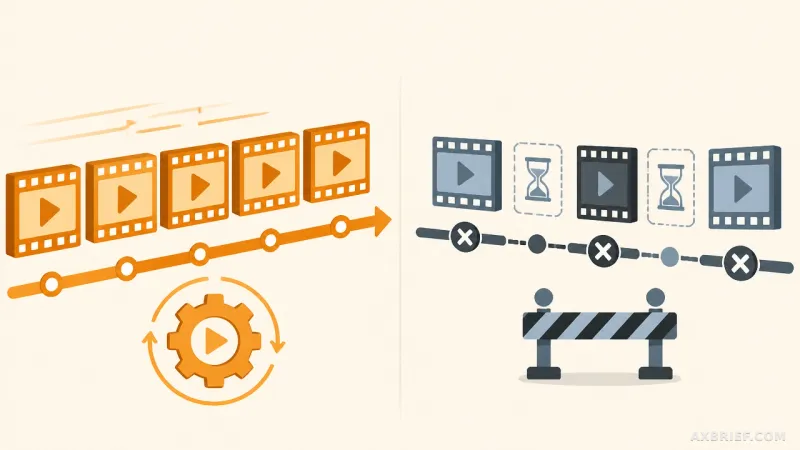
A healthcare organization sits on a goldmine of operational data. Years of sales transactions, product movement logs, patient interactions, and regional performance metrics are meticulously stored within Snowflake. The business team knows exactly what they need: a way to predict demand across product categories and identify seasonal consumption patterns to optimize their supply chain. However, there is a persistent wall between the data and the insight. Every time a business analyst wants to test a hypothesis or generate a forecast, they must submit a ticket to the data science team. They wait for a sprint cycle, hope the requirements are understood, and eventually receive a static report that is often outdated by the time it reaches the dashboard.
This is the classic data bottleneck. The people who understand the business domain most intimately are the ones least equipped to implement the machine learning models required to solve their problems. Traditional ML development requires a specialized stack of skills—Python, PyTorch, infrastructure orchestration, and deep statistical knowledge. When the gap between the hypothesis and the implementation is this wide, experimentation dies. Companies end up with massive cloud data warehouses that act more like archives than engines for growth, simply because the technical overhead of turning a row of data into a prediction is too high.
Democratizing Prediction with SageMaker Canvas
Amazon SageMaker Canvas changes this dynamic by introducing a visual interface that abstracts the complexity of the ML lifecycle. It allows business analysts, product owners, and operations managers to perform dataset exploration, feature preparation, and model building without writing a single line of code. Instead of waiting for an engineering team to design a pipeline, the domain expert takes the lead, using a drag-and-drop environment to build predictive models that reflect the actual nuances of their industry.
This shift does not require a company to abandon its existing investments in Snowflake. Instead, SageMaker Canvas acts as a bridge, extending the value of the Snowflake data warehouse by making its contents actionable for non-technical users. By allowing analysts to define features based on their own domain knowledge, the resulting models often achieve higher practical utility and faster iteration cycles than those built by engineers who may lack the specific business context.
Crucially, this accessibility does not come at the cost of enterprise security. The no-code environment operates within the existing governance framework of the organization. Data access permissions and management rules remain consistent with the established Snowflake and AWS security policies. The granular control that engineers previously handled manually is now integrated into an automated system, shifting the primary driver of development speed from infrastructure capability to business insight.
The Architecture from Snowflake to QuickSight
Moving data from a Snowflake warehouse to a live Amazon QuickSight dashboard involves a five-stage end-to-end architecture that eliminates the need for custom ETL scripts. The process begins with a direct connection between the transaction data stored in Snowflake and the SageMaker Canvas interface. Once connected, the user employs the visual tools within Canvas to explore the dataset and prepare the specific features required for the target prediction.
After the model is trained, the transition to production is handled through the Canvas model details page, where the user can deploy the model directly to an Amazon SageMaker Endpoint. This endpoint then processes the Snowflake transaction data to generate actual prediction values. These results are handled via batch prediction, where the scored datasets are output to Amazon S3. Finally, Amazon QuickSight connects to these S3 files, transforming the raw predictions into interactive, visual dashboards.
This workflow removes the traditional friction points of ML deployment. In a standard environment, moving a model from a notebook to a production endpoint requires selecting server instance types, configuring virtual private clouds (VPC), and managing complex IAM roles. SageMaker Canvas bypasses these low-level infrastructure steps entirely. Once the endpoint status switches to In service, the system immediately begins generating predictions based on the Snowflake data.
Shifting the Bottleneck from Engineering to Insight
The real transformation here is not just the absence of code, but the collapse of the operational cycle. By utilizing batch prediction to push results to S3 and then directly into QuickSight, the organization eliminates the middleman. There is no longer a need to export results into CSV files or manually update Excel spreadsheets to share findings with stakeholders. The path from a raw data point in Snowflake to a visual trend in QuickSight is now a straight line.
This architecture creates a feedback loop where business hypotheses can be tested in hours rather than weeks. When a business leader sees a prediction on a QuickSight dashboard that doesn't align with market reality, the analyst can return to SageMaker Canvas, adjust the features, and redeploy the model without needing a developer to rewrite the pipeline. The technical barrier is removed, meaning the only remaining constraint is the quality of the business question being asked.
This series provides a comprehensive roadmap for implementing this workflow. The first phase focuses on the foundational setup, including the activation of the AWS account and the configuration of the Snowflake environment. This involves creating the database and loading sample fraud detection data to serve as the training set. This stage is critical for extracting the necessary authentication keys and connection details that allow SageMaker Canvas to communicate with Snowflake.
Following the environment setup, the second part of the series will detail the process of connecting SageMaker Canvas to Snowflake, transforming the data, and building a functional fraud detection model. The final part will cover the integration with Amazon QuickSight, demonstrating how to turn those predictions into an interactive dashboard that provides real-time insights to decision-makers.