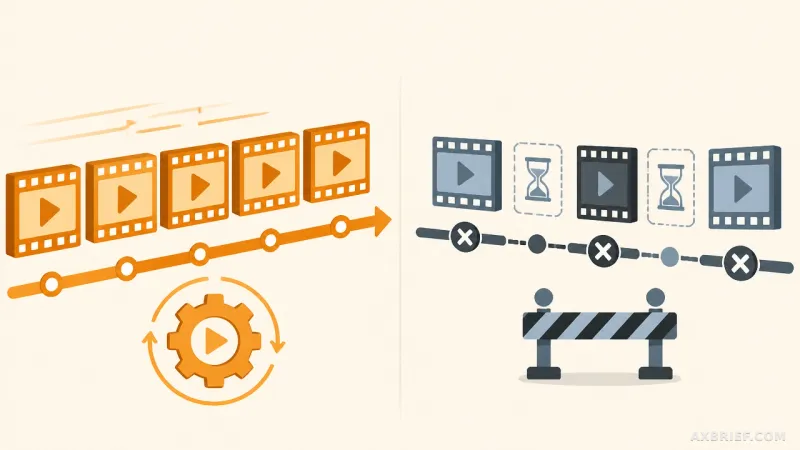
The initial excitement of deploying a coding agent usually begins at the individual level. A few early adopters in the engineering org find that their productivity spikes, the code quality improves, and the friction of boilerplate tasks vanishes. However, as these tools move from experimental silos to organizational standards, the conversation shifts. Leadership no longer asks if the tool works, but rather who is using it, how much it costs per department, and whether the resource consumption aligns with the actual value delivered. This transition from individual productivity to organizational governance is where most AI deployments hit a wall, as the lack of granular visibility turns the AI pipeline into a financial and operational black box.
The Architecture of Bedrock Codex Telemetry
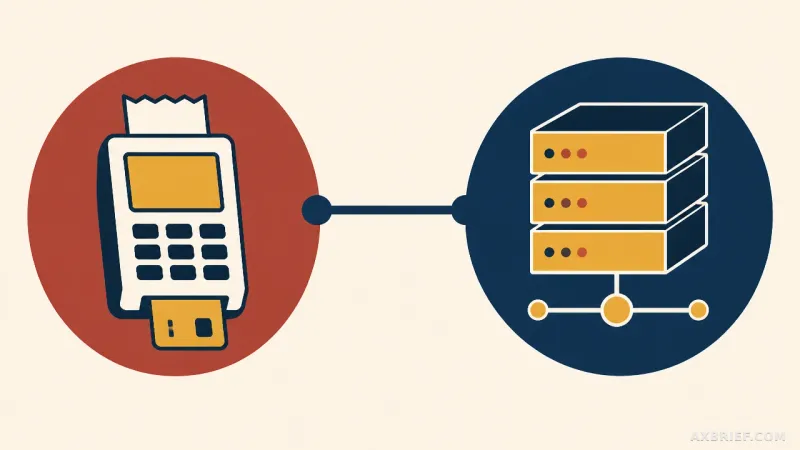
To solve this visibility gap, Codex on Amazon Bedrock leverages OpenTelemetry (OTel) to export activity data directly into Amazon CloudWatch. The system operates on a unified authentication framework where the same AWS identity is used for both model access and telemetry publishing. When a developer authenticates via IAM Identity Center and configures Amazon Bedrock as the model provider, Codex begins generating activity metrics. These metrics do not travel through a central proxy, which would introduce latency and a single point of failure. Instead, they are routed through a local OTel collector running on the developer's workstation, which then forwards the data to CloudWatch for visualization.
This decentralized approach ensures that the inference path remains lean. The local collector listens on the local host at 127.0.0.1, passively gathering data in the background without impacting the speed or stability of the AI's responses. For security, the data is transmitted to regional CloudWatch OTLP (OpenTelemetry Protocol) endpoints using AWS Signature Version 4 (SigV4) authentication. This ensures that short-term AWS credentials are used to secure the transit of data from the workstation to the AWS regional collection point. A primary example of such an endpoint is `https://monitoring.us-west-2.amazonaws.com/v1/metrics`.
From a data structure perspective, the collector treats `user.id` and `user.email` as mandatory resource attributes to ensure ownership is always clear. To provide the organizational context required for management, optional attributes such as department, team ID, cost center, organization, role, and manager information are attached. This allows the organization to categorize usage by team or department instantly without needing a separate mapping table. On the permissions side, the security footprint is kept minimal. The identity publishing the metrics only requires the `cloudwatch:PutMetricData` permission, removing the need for complex roles related to log group creation or Amazon ECS management.
From Raw Metrics to Adoption Signals
The real value of this architecture emerges when raw telemetry is transformed into actionable intelligence. By avoiding a central proxy, the system eliminates the operational burden of managing load balancers or Virtual Private Clouds (VPCs) for telemetry. The implementation begins with the activation of OTel enrichment and resource tagging through the following commands:
start-otel-enrichment
start-telemetry-enrichment
Once the CloudFormation stack deploys the CodexOnBedrock dashboard and the collector binary is secured, the setup utilizes the `--auto-lookup` option. This allows the system to automatically pull organizational attributes from the IAM Identity Center identity store. To prevent the creation of unnecessary time-series data, any unused optional attributes are deleted from the configuration block. The Codex metric exporter is then pointed to the local collector using the full path:
`"endpoint": "http://127.0.0.1:4318/v1/metrics"`
Verification of the pipeline is handled via a dedicated script to ensure the `codex.turn.token_usage` metric is reaching the server:
./check-otel-pipeline.shThis is where the technical implementation meets business analysis. Technical leaders can now use PromQL (Prometheus Query Language) to identify the actual adoption signals of the agent. While total token usage is a common metric, it is often a vanity metric. The true indicator of integration is the tool-call activity. By analyzing `codex.turn.tool.call`, leaders can see exactly where the agent is interacting with real-world workflows rather than just chatting. When cross-referenced with `codex.api_request` and `codex.api_request.duration_ms`, the organization can pinpoint exactly where users are experiencing performance bottlenecks.
Other critical metrics include `codex.turn.e2e_duration_ms` and `codex.turn.token_usage` for measuring the efficiency of individual turns, as well as `codex.thread.started` and `codex.conversation.turn.count` to track the longevity and depth of AI interactions. However, this granularity introduces the risk of cardinality explosion. Because CloudWatch OTel metrics are billed by the gigabyte and PromQL queries are priced based on the number of samples scanned, an over-abundance of unique tag combinations (e.g., too many unique user IDs or temporary identifiers) can lead to a spike in costs. Standardizing attribute names and removing non-essential fields is not just a cleanup task; it is a cost-optimization requirement.
Governance is further maintained through strict privacy settings. To ensure that sensitive source code or proprietary prompts are not leaked into the telemetry stream, the `log_user_prompt = false` setting is mandatory. This ensures the system tracks operational signals—the how and when—without storing the what. If an organization needs to kill the pipeline entirely, setting `[analytics] enabled = false` in the management config disables all data collection. To mitigate data loss during abnormal process terminations, the transmission interval can be adjusted via environment variables:
OTEL_METRIC_EXPORT_INTERVAL=1000It is important to distinguish between these telemetry metrics and actual financial billing. The token counts provided by CloudWatch OTel are for trend analysis and do not account for real-time discounts, credits, or fluctuating list prices. For precise accounting, organizations must still rely on AWS Cost and Usage Reports (CUR) 2.0 or the Amazon Bedrock cost management reports.
This shift toward OTel-driven visibility transforms the AI agent from a mysterious productivity booster into a manageable corporate asset.