An AI engineer stares at a terminal window where nvidia-smi reports a steady 100 percent GPU utilization. On paper, the hardware is fully saturated, suggesting that the only way to increase throughput or reduce latency is to provision more H100s. Yet, the actual tokens per second remain stubbornly low, and the system feels underpowered despite the maximum reading. This is a common friction point in modern LLM deployment, where the tools used to monitor the hardware often provide a binary signal of activity rather than a nuanced measure of efficiency. The industry has long relied on metrics that signal whether a GPU is working, but rarely whether it is working at its full potential.
The Architecture of Precision Monitoring
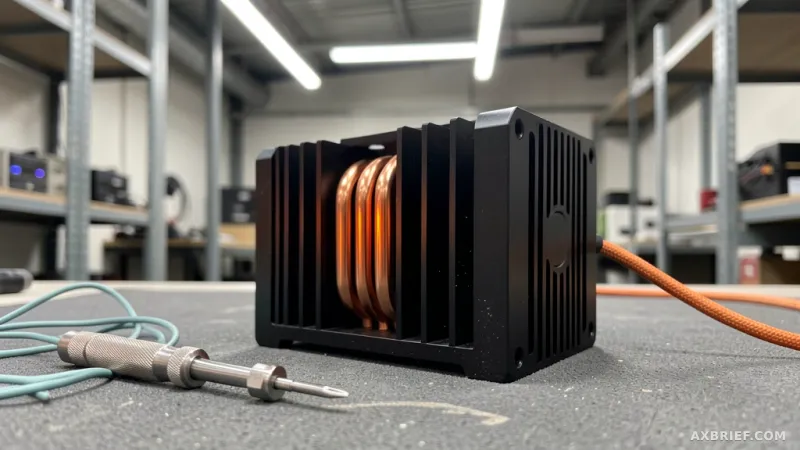
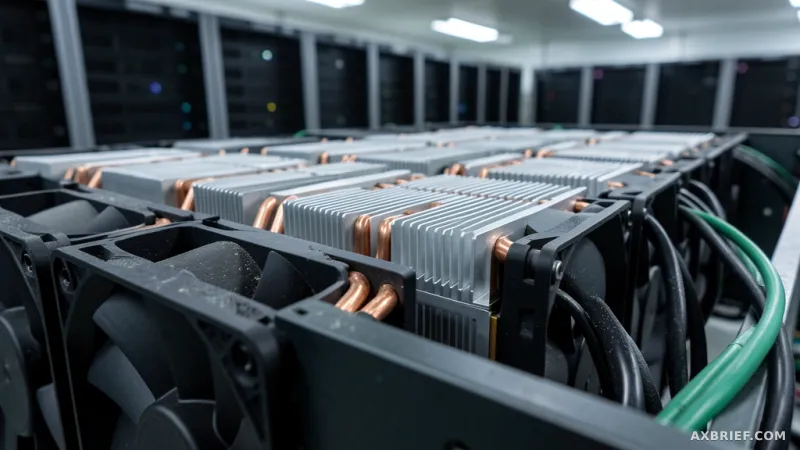
Utilyze enters this space as a specialized diagnostic tool designed to strip away the illusions of standard monitoring. To achieve this level of granularity, the tool requires a hardware baseline of NVIDIA Ampere architecture or newer. This includes the enterprise-grade A100, H100, H200, and B200 series, as well as consumer-grade RTX 3000 series and subsequent models. By targeting these specific architectures, Utilyze can tap into the precise hardware design blueprints required for deep-level profiling. In high-density server environments, the tool supports configurations where up to eight GPUs are clustered within a single node, specifically catering to the H100-80G and A100-80G models that form the backbone of most enterprise AI clusters.
Currently, the backend of Utilyze is engineered exclusively for vLLM, the high-throughput inference library. This strategic focus allows the tool to automatically detect inference servers and identify exactly which models are loaded into GPU memory in real time. While the roadmap includes support for other libraries like SGLang, the current vLLM integration ensures that the tool reads not just the physical hardware state, but the software layer's interaction with that hardware. This dual-layer visibility is what allows the tool to provide a more accurate analysis of how a model is actually executing on the silicon.
From a deployment perspective, Utilyze is released under the Apache-2.0 license, allowing developers to modify, distribute, and use the software commercially without restriction. However, because the tool accesses deep hardware performance counters, it encounters standard Linux security barriers. Users attempting to run the program without sudo privileges must modify the system kernel settings to allow non-administrative profiling. This requires applying the following configuration and rebooting the system:
NVreg_RestrictProfilingToAdminUsers=0This modification essentially unlocks the hardware information vault, granting standard user accounts the ability to collect real-time monitoring data without requiring constant privilege escalation. Once configured, the system operates via a decoupled architecture. A Linux-based profiling server handles the heavy lifting of collecting hardware counters, while a remote client running on macOS or Windows visualizes the data. These two endpoints communicate through WebSockets, ensuring a low-latency, bidirectional flow of information that allows an operator to monitor a hot server rack from a comfortable workstation.
Decoding the Illusion of Full Capacity
To understand why Utilyze is necessary, one must first understand the failure of traditional tools like nvidia-smi and nvtop. When these tools report 100 percent utilization, they are not measuring the percentage of the GPU's total computational capacity being used. Instead, they are reporting whether at least one kernel is currently executing on the GPU. If a single, tiny task is running, the tool flags the GPU as 100 percent utilized. It is the equivalent of a restaurant hanging an Open sign on the door because one person is sitting at a single table; the sign says the business is active, but the kitchen and the other ninety-nine tables are completely idle. This creates a dangerous optical illusion where engineers believe they have hit a hardware ceiling when they are actually suffering from software inefficiency or data bottlenecks.
Utilyze replaces this binary check with a direct read of the GPU's internal performance counters. Rather than asking if the GPU is busy, it asks exactly how many execution units are firing and how much of the theoretical throughput is being realized. This shift from activity-tracking to capacity-tracking reveals the actual waste in the system. Because the tool is designed for minimal overhead, this deep introspection does not degrade the performance of the production inference service, making it viable for live environment monitoring.
The most critical insight provided by Utilyze is the Attainable SOL, or Attainable Speed of Light. In theoretical physics, the speed of light is an absolute limit; in GPU computing, the theoretical peak is often unreachable due to the specific constraints of a model's architecture, the workload's batch size, and the hardware's memory bandwidth. Attainable SOL calculates the realistic maximum utilization possible for a specific combination of model and hardware. It tells the engineer not what the GPU is capable of in a vacuum, but what it is capable of for this specific task.
When an engineer compares the current real-time usage against the Attainable SOL, the nature of the problem changes. If the real usage is 30 percent but the Attainable SOL is 80 percent, the engineer knows the hardware is not the bottleneck. The issue lies in the software configuration, the KV cache management, or the data pipeline. Conversely, if the real usage is nearly identical to the Attainable SOL, the engineer has definitive proof that the hardware is truly saturated and that scaling out is the only remaining option. This removes the guesswork from infrastructure planning and prevents the costly mistake of purchasing additional GPUs to solve a software problem.
Despite its power, the tool has a hard technical constraint: only one instance can monitor a single device ID at a time. This is not a limitation of Utilyze itself, but a restriction of the NVIDIA Perf SDK API. The pathway to the hardware's deep performance data is a single-access channel. If multiple developers attempt to profile the same GPU simultaneously, the API will trigger an access conflict, and monitoring will fail. This requires teams to coordinate their profiling windows or implement a rotation for who is accessing the live telemetry.
Ultimately, the goal of this precision is financial and operational efficiency. In an era where a single H100 cluster can cost millions of dollars, the difference between a fake 100 percent and a real 100 percent is a massive line item in a company's budget. By identifying the actual physical headroom in a cluster, teams can increase batch sizes or consolidate workloads onto fewer GPUs without sacrificing performance. The path to cost optimization in AI is not found in buying more compute, but in finally seeing exactly how much of the compute you already own is actually being used.