It is 4 PM on a Friday, and the AWS billing dashboard shows a steep, alarming climb in GPU expenditures. Simultaneously, the customer support queue is filling up with reports that the AI's responses have become erratic or less helpful than they were a week ago. This is the classic paradox of Large Language Model (LLM) operations: infrastructure costs are scaling upward, yet the actual utility of the output is sliding downward. In traditional software, a developer could rely on error rates and latency to gauge health. But LLMs introduce a volatile variable where a slight shift in input can cause quality to plummet, even while the underlying hardware reports perfect health. This gap between infrastructure telemetry and model performance creates a blind spot that makes cost-effective scaling nearly impossible.
The Architecture of Integrated LLM Observability
Managing a diverse fleet of models, such as gpt-oss-20b and Qwen2.5-7B-Instruct, on a single server environment is a complex orchestration challenge. Amazon SageMaker AI addresses this through a feature called Inference Components. Rather than treating the server as a monolithic resource, Inference Components allow operators to carve out dedicated resource segments for each model. This ensures that routing logic and scaling policies remain independent, preventing a surge in requests for one model from starving another of resources. Each component generates its own distinct telemetry, allowing for granular tracking of how specific models consume shared infrastructure.
This telemetry flows into Amazon CloudWatch, where the system enforces a strict separation of data types through two distinct namespaces. The first is the quantitative layer, which tracks raw infrastructure metrics. Data such as GPU utilization, invocation counts, response latency, and error rates are stored under the path `/aws/sagemaker/InferenceComponents/<model-name>`. The second is the qualitative layer, where user-defined quality metrics—such as answer accuracy, safety scores, and adherence to guidelines—are stored under `/aws/sagemaker/inference-quality/<model-name>`. By isolating these paths, SageMaker prevents operational noise from polluting the performance data.
The final piece of the stack is Amazon Managed Grafana, which aggregates these disparate CloudWatch streams into a single, unified visualization layer. This allows a lead engineer to view GPU memory saturation and model hallucination rates on the same screen. By overlaying latency trends with total invocation volume, teams can pinpoint exactly which model is driving costs or where GPU allocation has become inefficient. For those looking to implement this architecture, the AWS samples GitHub repository provides the necessary configuration examples and dashboard templates.
The Tension Between Quantity and Quality
Reducing cloud spend requires more than just seeing a total cost; it requires understanding the causal link between resource expenditure and output value. The decision to split infrastructure and quality metrics into separate namespaces is not merely an organizational choice but a diagnostic necessity. When response times spike, an operator must immediately know if the bottleneck is a hardware limitation, such as GPU memory exhaustion, or a software limitation, such as a slow quality-evaluation pipeline. If these metrics were blended, the root cause would remain obscured by the volume of data.
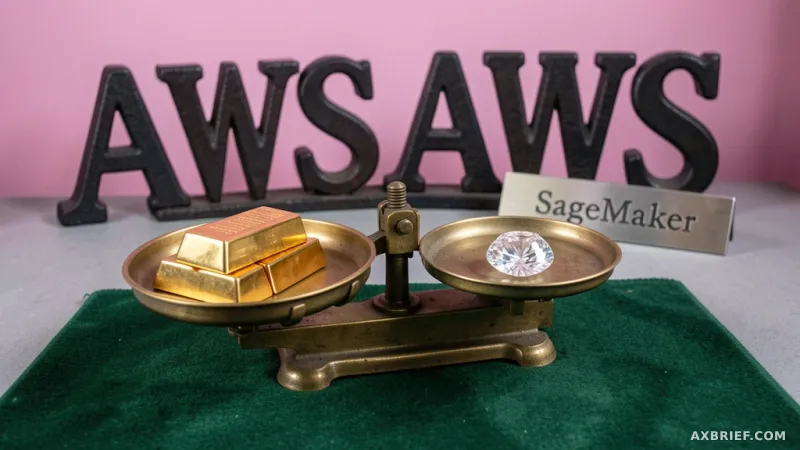
Quantitative monitoring is akin to watching a car's speedometer and fuel gauge. It tracks efficiency, throughput, and resource consumption. It tells the developer if the system is running, but it cannot tell them if the system is correct. Qualitative monitoring, conversely, is the GPS that confirms the car is actually heading toward the right destination. A model can return a response in 200 milliseconds with 10% GPU utilization, but if that response violates safety guidelines or provides a factually incorrect answer, the operational efficiency is irrelevant.
When these two streams are monitored in isolation, dangerous imbalances occur. A team might see a healthy infrastructure dashboard and assume the service is performing well, while users are receiving useless answers. Alternatively, a team might achieve gold-standard answer quality but do so by over-provisioning expensive GPU instances that remain 70% idle. The insight emerges only when these two axes are contrasted. By analyzing the correlation between resource input and quality output, engineers can make data-driven decisions to downsize instances or switch to a more efficient model architecture without sacrificing the user experience.
Solving Over-Provisioning and Model Drift
In a production environment, this integrated visibility transforms how engineers handle resource allocation. By utilizing panels that display hourly costs per model, teams can identify the specific models that are draining the budget. Comparing active GPU counts against idle capacity allows for the immediate detection of over-provisioning, enabling operators to shrink the resource footprint in real time. This moves the organization away from the common practice of over-allocating resources as a safety margin, which often leads to massive waste.
Diagnostic precision also improves when analyzing bottlenecks. If the dashboard shows that GPU compute utilization is at 95% while memory remains at 40%, the bottleneck is the processing speed. In this case, upgrading to a faster GPU is the logical move. However, if memory is capped while compute is low, the issue is the data volume or the model size, suggesting a need for a model with a larger context window or a different memory-optimized instance type. This level of granularity prevents the expensive mistake of upgrading the wrong hardware component.
Beyond hardware, the system is designed to catch model drift—the gradual degradation of a model's performance as the nature of real-world input data evolves. By tracking a composite quality score and safety metrics over time, operators can spot the exact moment a model begins to deviate from its expected behavior. When quality-evaluation latency is tracked alongside inference latency, engineers can determine if a performance drop is due to the model's internal reasoning capabilities or a bottleneck in the evaluation system itself.
Transitioning from PoC to Production LLMOps
Moving a project from a Proof of Concept (PoC) to a production-grade service requires a shift in mindset. In a PoC, a few impressive answers are enough to prove value. In production, a single incorrect or unsafe answer can carry significant financial or reputational risk. This necessitates a two-tier monitoring strategy: random sampling of generated responses for human review, coupled with automated quantitative scoring. The goal is to convert the subjective nature of a conversation into a hard number that can be monitored via an alert.
True operational maturity is reached when hardware signals and quality signals are linked to an automated alerting system. For instance, if response latency remains stable but the safety score drops below a specific threshold, the system should trigger an immediate notification. This allows the team to distinguish between a hardware failure and a model failure instantly, drastically reducing the mean time to resolution (MTTR).
Ultimately, the role of the LLMOps engineer is to find the equilibrium between cost and performance. One model may be lightning-fast but imprecise, while another is perfectly accurate but prohibitively expensive. The ability to visualize these trade-offs on a single screen removes the guesswork from the equation. By unifying the fragmented views of the server administrator and the data scientist, Amazon SageMaker enables a sustainable approach to AI deployment where every dollar spent on compute is directly tied to a measurable increase in answer quality.