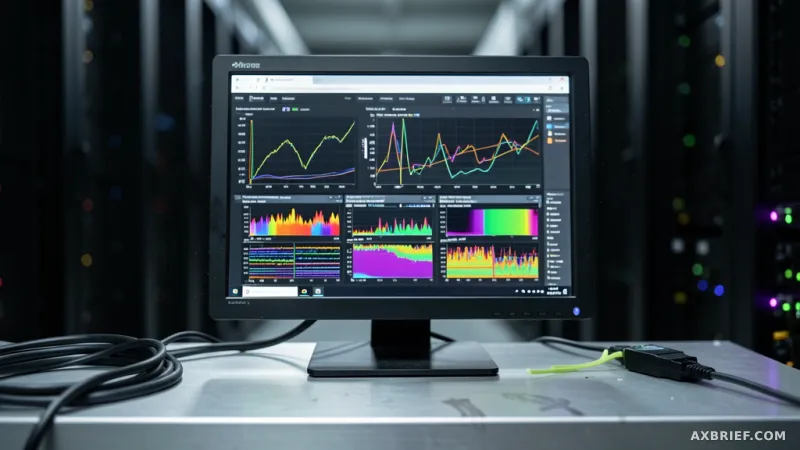
Imagine the dashboard turns red. Your P99 latency has just spiked, and users are complaining that the AI feels sluggish or is cutting off mid-sentence. For most SREs and LLM engineers, this is where the guessing game begins. Is the GPU memory saturated? Is there a routing bottleneck in a specific availability zone? Or is the model simply struggling with a massive prompt that has exhausted the KV cache? Until now, the internal state of an inference endpoint was largely a black box, leaving teams to rely on aggregate metrics that obscured the root cause of performance degradation.
The Architecture of SageMaker Insights
Amazon SageMaker AI has addressed this visibility gap with the introduction of SageMaker Insights, a managed observability solution built directly into Amazon CloudWatch. Rather than providing simple aggregate counts of requests or total latency, SageMaker Insights exposes over 100 detailed inference metrics. This allows operators to peer into the internal health of their endpoints and pinpoint failures in minutes rather than hours. The scope of these metrics is comprehensive, covering GPU health, token-level latency, traffic distribution across Availability Zones (AZ), and the precise deployment status of inference components.
At its core, the system leverages OpenTelemetry, the industry standard for cloud-native observability. By using OpenTelemetry to transmit native metrics, SageMaker AI ensures that logs and metrics are collected through a unified protocol. These data points are then visualized and queried using PromQL, the powerful time-series query language used in Prometheus. This architectural choice means that infrastructure engineers can perform complex calculations on their telemetry data without needing to build custom, fragile dashboards from scratch.
For developers deploying new endpoints, the system is designed for immediate utility. The `EnableDetailedObservability` parameter is set to true by default, meaning detailed metric collection is active from the moment of launch. To manage the granularity of this data, users can adjust the `MetricsPublishFrequencyInSeconds` parameter. While the default is 60 seconds, high-load workloads that require second-by-second precision can lower this value to capture transient spikes that would otherwise be smoothed over by a one-minute average.
Existing endpoints require a brief opt-in process to enable these features. This is handled via a three-step wizard in the SageMaker console, where users apply a new endpoint configuration containing the `MetricsConfig` flag. This process is designed to be non-disruptive, allowing settings to be updated without service downtime. To ensure the data flows correctly into CloudWatch, users must enable OTel metric enhancement and resource tagging for telemetry in the CloudWatch settings. Once the endpoint reaches the `InService` state, OpenTelemetry-formatted metrics typically begin appearing within two minutes.
Deconstructing Latency and the KV Cache Twist
While more metrics are helpful, the true value of SageMaker Insights lies in how it decomposes the user experience. Traditional monitoring measures the time from request to final response, but this is a blunt instrument. It cannot distinguish between a slow start and a slow stream. SageMaker AI solves this by splitting latency into Time to First Token (TTFT) and Inter-Token Latency (ITL). TTFT measures the gap between the user's request and the appearance of the first character, which defines the perceived responsiveness of the AI. ITL measures the interval between subsequent tokens, which determines the smoothness of the streaming output.
To find the actual source of a delay, the platform further separates Model Latency from Overhead Latency. Model Latency is the raw compute time the model spends processing data, while Overhead Latency covers the time spent routing and scheduling the request through the platform. This distinction is critical. If both metrics appear healthy but TTFT remains high, it is a definitive signal that requests are queuing inside the inference engine, waiting for available KV cache slots.
This is where the focus on the Key-Value (KV) cache becomes a game-changer. The KV cache stores previous token information to avoid redundant computations during generation. When this cache fills up, the engine must queue new requests, leading to a precipitous drop in response speed. SageMaker Insights allows engineers to monitor KV cache pressure in real-time. By tracking this pressure across different frameworks like vLLM, SGLang, and the Deep Java Library (DJL), operators can see exactly how memory is being utilized.
This level of granularity transforms how teams handle scaling. Instead of reacting to a P99 spike after the user experience has already degraded, engineers can set auto-scaling thresholds based on KV cache occupancy. For example, if cache utilization consistently hits 40 to 50 percent, the system can trigger the deployment of additional instances before the queue builds up and latency spikes.
Visibility extends to the physical distribution of the fleet through a hexagonal grid view. This visualization maps every resource in the fleet, using color-coding to indicate health. By hovering over a hexagon, an operator can instantly see the instance type, TTFT, output tokens per second (TPS), concurrent requests, and KV cache occupancy. If a specific Availability Zone shows zero traffic while others are overloaded, the team can immediately identify a routing misconfiguration or an AZ-specific outage rather than wasting time debugging the model code.
Quantifying Efficiency and Reducing GPU Waste
Beyond troubleshooting, SageMaker Insights provides a framework for rigorous cost and performance optimization. The platform measures Token Throughput, splitting it into input and output streams. Input throughput reflects how quickly the model consumes the prompt, while output throughput measures the generation speed. This allows teams to identify whether a bottleneck is occurring during the prefill phase or the decoding phase.
Consider a scenario using `ml.g6.4xlarge` instances. If a model benchmark suggests a throughput of 500 TPS, but the actual production output is only 150 TPS, there is a clear discrepancy. By cross-referencing this with KV cache pressure and concurrent request data, an engineer can determine if the issue is a resource constraint or a configuration error. This data-driven approach removes the guesswork from infrastructure procurement, ensuring that companies only pay for the GPU capacity they actually need.
Furthermore, the ability to compare different inference engines on the same hardware is invaluable. Because the dashboard supports multiple frameworks, operators can run A/B tests between vLLM and SGLang to see which engine maintains lower latency and higher throughput for their specific model and prompt length. By quantifying the performance delta between engines, teams can select the most efficient stack, directly reducing the number of required GPU instances and lowering the overall cloud bill.
In the high-stakes environment of generative AI, a slow response is often perceived as a broken response. By replacing intuition with 100+ precise metrics and OpenTelemetry-based observability, Amazon SageMaker AI turns the art of LLM tuning into a science. The ability to distinguish between a routing error, a memory bottleneck, and a framework inefficiency allows operators to maintain a seamless user experience while maximizing the efficiency of their most expensive hardware assets.
The era of guessing why an LLM is slow is over; the era of precision tuning has arrived.